Smart Spectrum Engineering & Technical Frequency Analysis

SPECTRAemc is an advanced spectrum engineering and frequency analysis solution designed to ensure efficient use of the valuable radio spectrum. With a comprehensive library of wave propagation models, it supports key spectrum tasks including coverage prediction, interference assessment, channel assignment, and both national and international coordination.

SPECTRAemc is a proven solution, used by spectrum authorities and organizations in numerous countries. Its performance, accuracy, and ease of use are relied upon by users in spectrum regulation, defense, airport coordination, and wireless industries.

The unique wizard workflow engine of SPECTRAemc guides the users smoothly through each engineering or analysis task. Experts can predefine the most complex parameters, ensuring accuracy while making the tool intuitive for both junior and senior staff.

Technical Features of SPECTRAemc

Explore core functions designed to power precise engineering and automated workflows.

A chart titled 'Wellen-Ausbreitungsmodelle' (Wave Propagation Models) displaying various radio wave propagation models across frequency ranges from 3 Hz to 3000 GHz. Horizontal bars represent models such as Sky-Wave, Ground Wave, ITU Shortwave, ITU VHF, Longley-Rice, and Free Space Model, indicating their operational frequency ranges.

Comprehensive Propagation Model Library

Fully ITU-compliant and up-to date models from VLF to EHF to support all radio services including fixed, land mobile, aeronautical, etc.

3D coverage and network performance prediction map showing terrain, vegetation, and environmental impact zones

Coverage & Performance Prediction

Accurate coverage predictions for single stations and complete networks considering topography, land usage and other environmental impacts.

A software interface displaying frequency assignment results. The top left section lists channels with details such as frequency, bandwidth, and quality indicators marked in green, red, or yellow. The top right section shows a channel chart with a bar graph indicating frequency quality and assignments. The lower part includes tables for 'Assignments' and 'Conflicts', showing information about assigned frequencies and any conflicts detected.

Interference & Frequency Analysis

Intra-/inter-service interference checks, channel evaluation, and automatic frequency assignment.
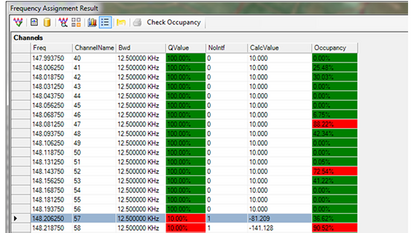
A software interface titled 'Frequency Assignment Result' displaying a table of frequency channels. Columns include frequency (Freq), channel name, bandwidth (Bwd), quality value (QValue), number of interferences (NoIntf), calculated value (CalcValue), and occupancy. Cells in the occupancy column are color-coded, with green indicating low usage and red showing high usage or interference.

Real-World Monitoring Integration

Integrate LS OBSERVER data to support frequency assignments, verify simulation results and detect anomalies.

3D radiation pattern on a telecom tower visualizing EMF exposure zones for safety and compliance with international limits

Safety Zone & EMF Calculation

Assess EMF exposure zones in compliance with national and international thresholds.
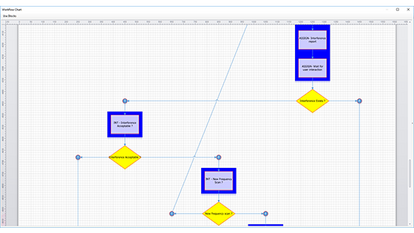
A workflow chart displaying a process flow with interconnected steps. The chart includes rectangular blue boxes labeled 'NT - Interference Acceptance' and 'NT - Test Frequency Scan #1' connected by lines to yellow diamond-shaped decision nodes labeled 'Interference Exists' and 'New Frequency Exists'. Another blue box at the top right contains two substeps labeled 'ASSIGN Interference report' and 'ASSIGN Wav for Interference'. Lines and arrows indicate the sequence and decision paths.

Wizard-Based Automation

Simplify complex tasks with expert-defined workflows using a unique wizard engine.

A process flow diagram illustrating data exchange between three entities: 'office', 'emc', and a field agent. A blue user icon labeled 'office' on the left connects to a checklist icon at the top, leading to a bar chart icon labeled 'emc' on the right. A black figure at the bottom represents a field agent, with arrows indicating data flow between all three entities.

Spectrum Management Integration

Provide accurate frequency assignments for applications from mySPECTRA or mySPECTRA for Defense avoiding harmful interference cases.

A diagram illustrating a centralized database system. A blue database icon at the top is connected via lines to three user icons, each displayed on separate monitors. This represents multiple users accessing a shared central database.

Scalable Multi-User Architecture

Use SPECTRAemc either offline and standalone or in a multi-user environment with a central database (Oracle, PostgreSQL).

Two people shaking hands to symbolize international coordination and spectrum notification partnership with SPECTRAemc

International Notification & Exchange

Automate bilateral/ITU coordination, BRIFIC integration, and notification management.

Why Choose SPECTRAemc?

Key benefits of using SPECTRAemc for technical spectrum management.

Standards-Compliant

Uses ITU recommendations (e.g. P.452, P.530, P.1411) to ensure accurate and reliable output.

Automated Workflows

Wizard engine simplifies complex analysis with expert-defined, user-friendly guidance.

Broad Use Case Support

Applicable to regulation, military and airport scenarios with sector-specific functionalities.

Interference Mitigation

Identify and resolve interference with visual modeling and spectrum simulation.

Ecosystem Integration

Part of LS telcom’s modular suite, linked with mySPECTRA and LS OBSERVER.

Advanced Visualization

Includes GIS, 2D/3D mapping, and layered signal data visualization for high usability.

Key Applications Across Industries

Use SPECTRAemc in a wide range of regulatory and operational environments.

Illuminated city skyline with overlaid wireless and spectrum connectivity symbols representing modern spectrum regulation.

Spectrum Regulation

Automate and accelerate spectrum coordination and assignment.

SPECTRAemc supports regulators with tools for coverage prediction, interference analysis, and channel assignment using ITU-compliant models.
Automate complex tasks with the wizard engine, and streamline coordination with neighboring countries or international bodies like the ITU.

A soldier in tactical gear using a handheld radio while observing a laptop displaying a detailed topographic map. The map shows terrain features and marked points, suggesting a navigation or mission planning scenario in a desert environment.

Defense & Security

Enable automated spectrum analysis for mission-critical operations.

In tactical operations, SPECTRAemc delivers automated frequency analysis, interference checks, and scenario-based planning.
With its wizard engine and support for NATO SMADEF, the system assures interoperability with allied forces and facilitates the provision of reliable communication networks in congested and contested environments.

Panoramic view of an airport at sunset with the control tower centered. Overlaid network graphics connect various nodes with lines, featuring icons labeled '4G', 'LPWAN', and others, symbolizing wireless communication and network integration at the airport.

Airports

Protect wireless communication across smart airport environments.

SPECTRAemc ensures safe frequency usage for radar, links, and airport systems.
It supports coverage prediction, interference mitigation, and coordination using ICAO COM2–COM5 standards.